-
Q.
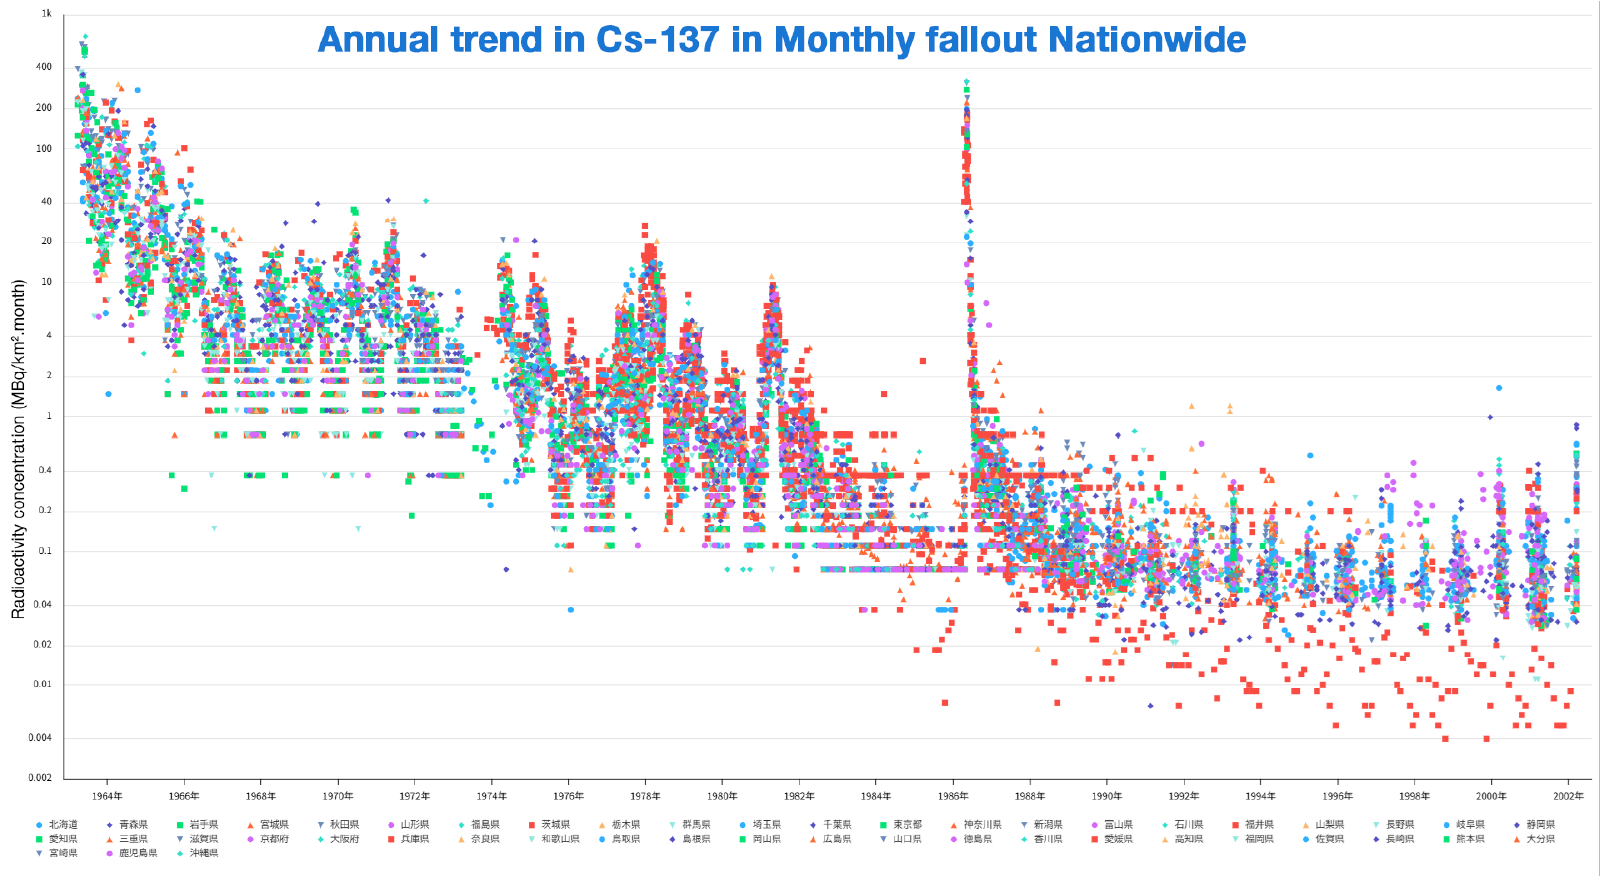
Why is the concentration of Cs-137 in monthly fallout very high at one point?
-
A.
It temporarily increased in 1986 due to the Chernobyl Nuclear Power Plant accident.
Explanation
This chart shows the change in the amount of Cs-137 that fell in a month per square kilometer as contained in rainwater and dust (fallout) in Japan. As atmospheric nuclear tests ceased in 1980, the monthly Cs-137 fallout had been reducing since 1981. However, it temporarily increased in 1986 due to the Chernobyl Nuclear Power Plant accident. Since then, the monthly Cs-137 fallout remained at about 1/20 of that in the 1970s, but it increased in March 2011 likely due to the accident at the TEPCO Fukushima Daiichi Nuclear Power Station.
Reference:Environmental Radiation Database
-
Q.
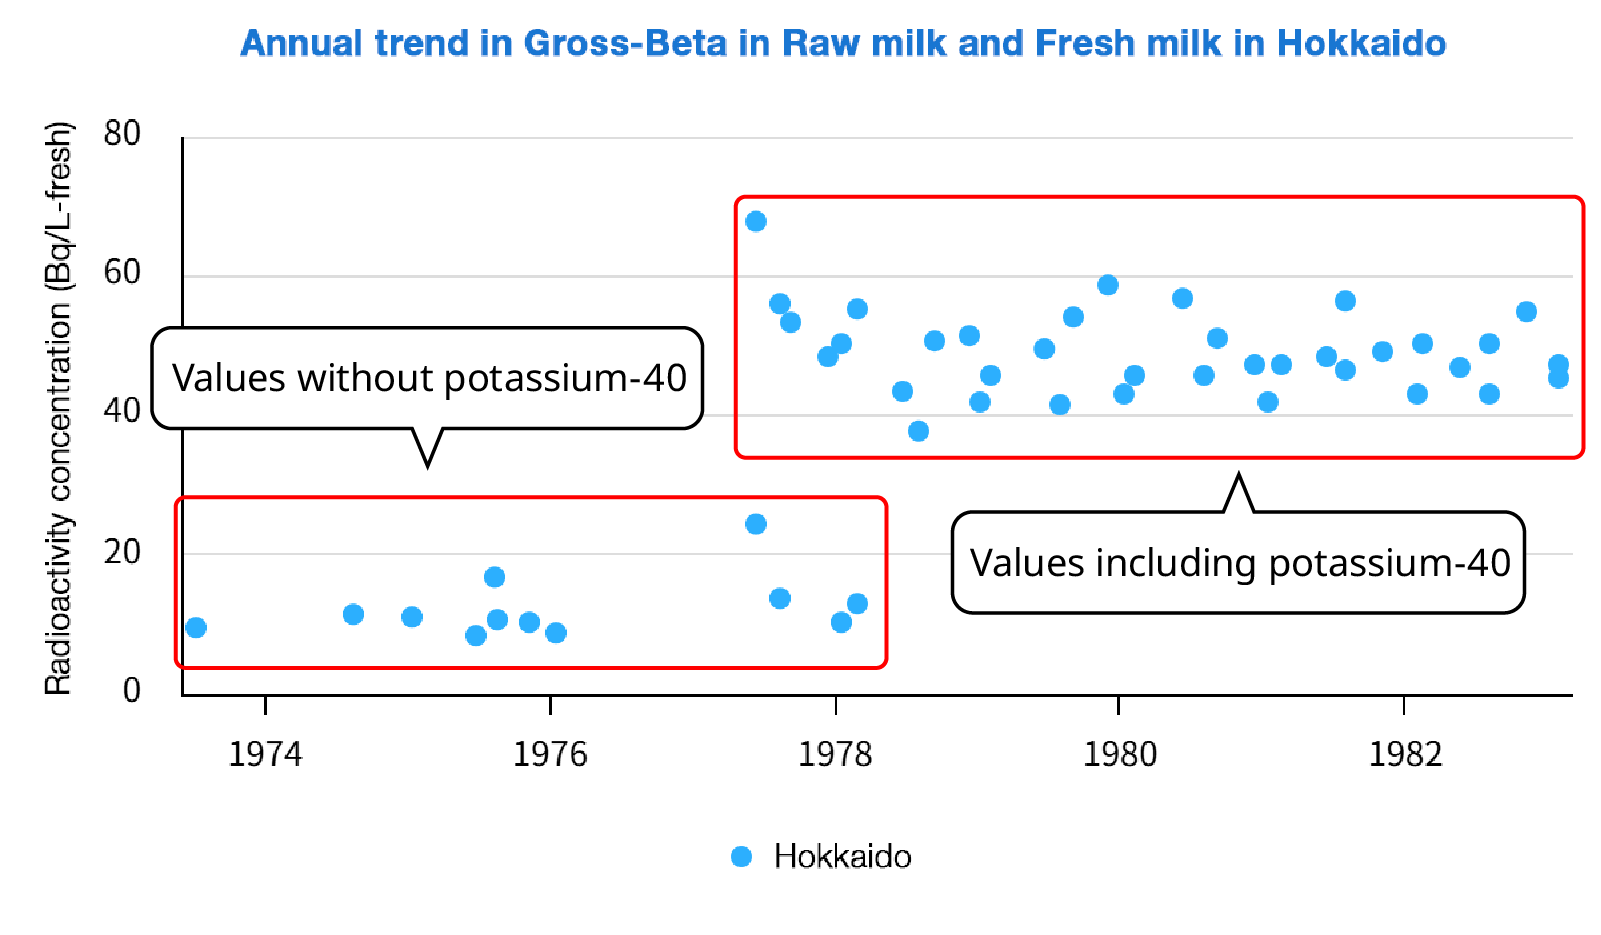
Why is the total beta value suddenly different after 1977?
-
A.
Before 1976, the contribution of potassium-40, natural radioactivity contained in samples, was subtracted from the results. In 1976, the Measurement of Gross Beta Radioactivity was revised to include the contribution of natural radioactivity; consequently, the total beta value have since increased significantly.
Explanation
This chart shows the change in total beta in raw milk sampled in Hokkaido from 1973 to 1982. Due to the revision of the Measurement of Gross Beta Radioactivity in 1976, the total beta started to show larger values around this year.