Select Chart Type
Using data registered to the Environmental Radiation Database, you can create charts and tables of air radiation dose rates, annual changes, concentration ranges, and statistical summaries under the conditions you specify. You can easily create a chart or table by selecting the type you wish to generate and following the instructions displayed on your screen. Please note that some data for the atmosphere and ocean cannot be specified for certain prefectures, and you cannot create charts for such data.
-
Ambient Dose Rate Map
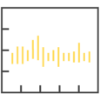
You can create a chart in which ambient dose rate data (maximum, average, minimum) are plotted.
FAQ about this chart -
Annual Trend Chart
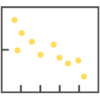
You can create a chart in which radioactivity concentration is plotted against time (year).
FAQ about this chart -
Radioactivity Concentration Range Chart
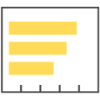
You can create a radioactivity concentration range chart using radioactivity concentration data.
FAQ about this chart -
Create a Summary Table

You can create a summary table by specifying conditions such as survey year and survey area.
-
Aggregated Ambient Dose Rate
You can create a statistical table of spatial dose rates based on the measurement results from monitoring posts established in all 47 prefectures through the Environmental Radiation Level Survey.