-
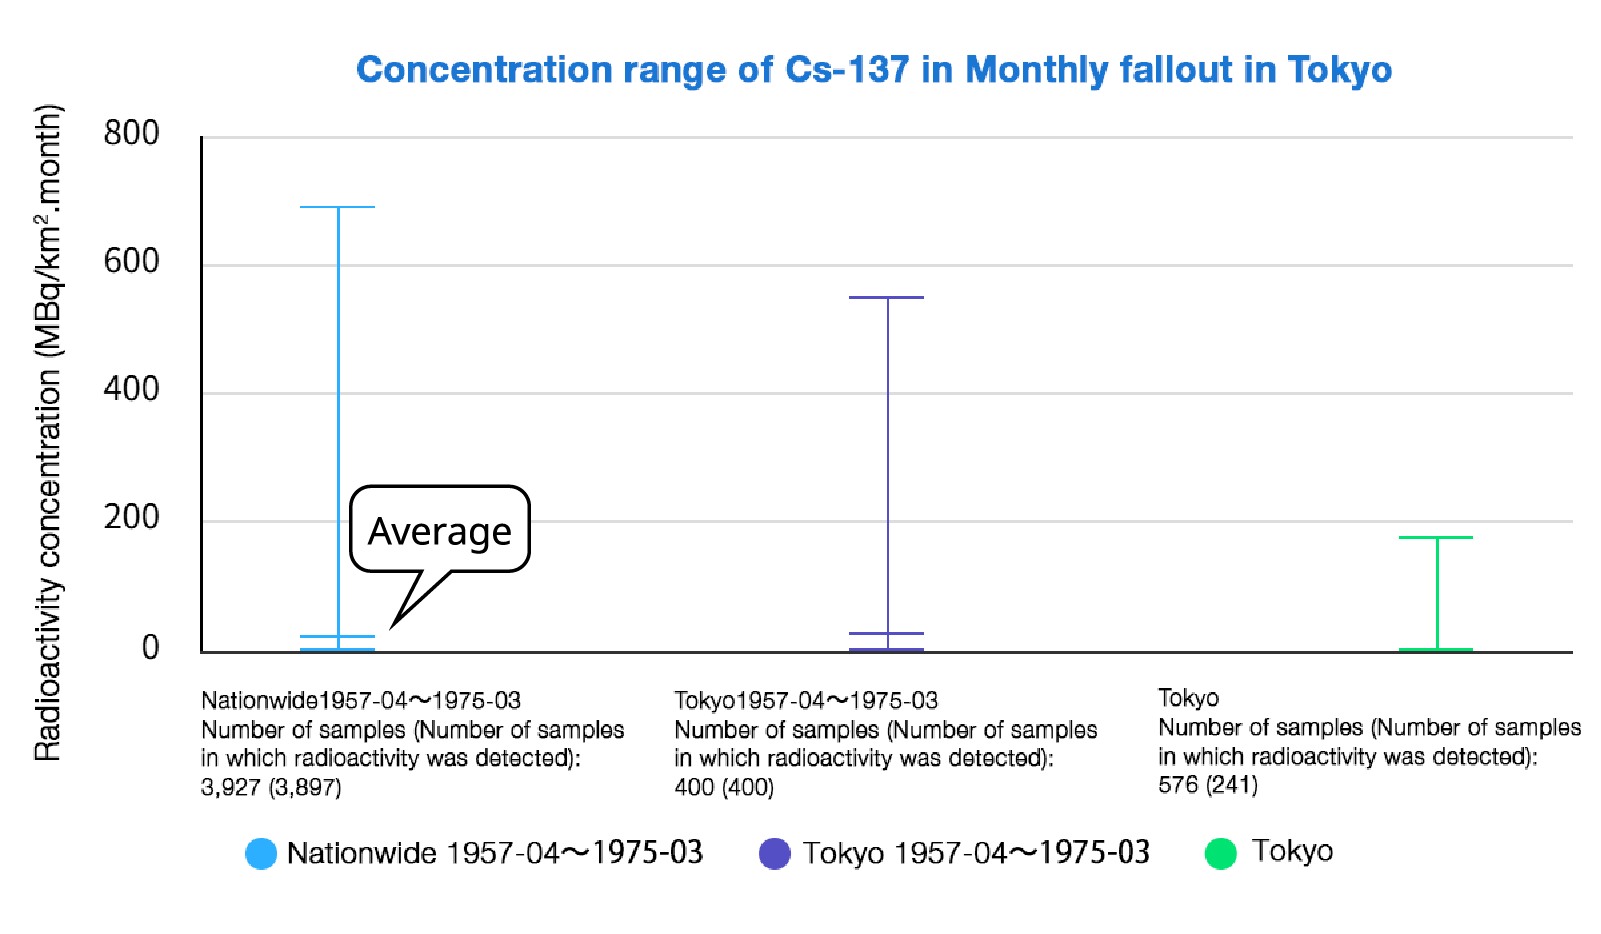
Q.
Why was the radioactivity concentration in Japan high in the past?
-
A.
The radioactivity concentration was high in the past due to atmospheric nuclear tests conducted from 1945 to the 1980s or the Chernobyl Nuclear Power Plant accident that occurred in 1986.
-
Q.
Why is the average value shown at a very low position in the chart?
-
A.
The number of samples that exhibited a high radioactivity concentration value is much smaller than the number of samples that exhibited a low radioactivity concentration value. As a result, the average value became smaller.